Poster Placement in AR
The initial idea of this project was furniture placement. Due to the poor 3D object tracking performance, I changed my mind and tried tracking the image and placing the poster on the wall.
Hololens 2 was used in this project.
Furniture placement
Initially, I used a 3D scanner to capture models of chairs and cups for tracking. The model is scanned and processed to generate a database of model targets that Vuforia can use for accurate tracking. When Vuforia detects a model, virtual furniture objects are overlaid on the detected surfaces, providing users with an immersive and interactive visualization experience. However, these scanning models were discarded due to tracking difficulties and poor performance.
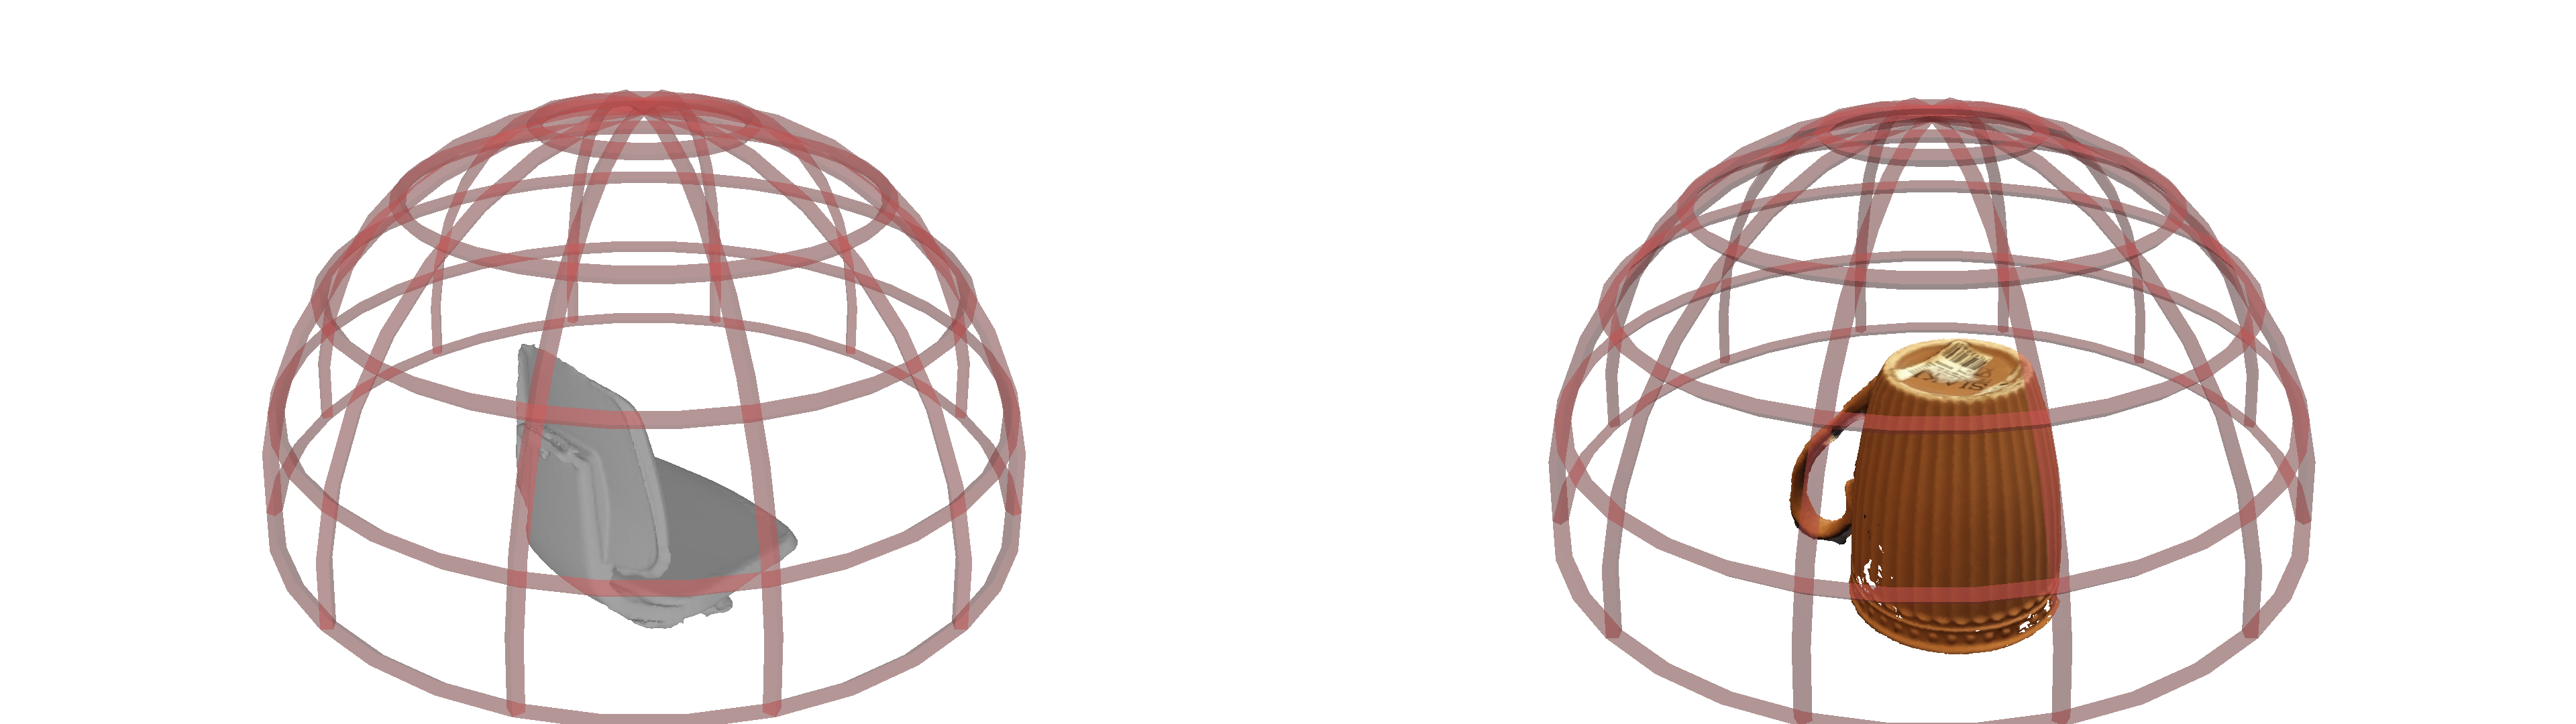
To solve the tracking problem, a model of the Viking lander was created using a 3D printer. This model serves as a training object for the target features of the Vuforia model, aiming to improve tracking accuracy and stability. However, performance remains poor. Augmented reality furniture placement applications perform poorly due to hardware limitations and tracking challenges.
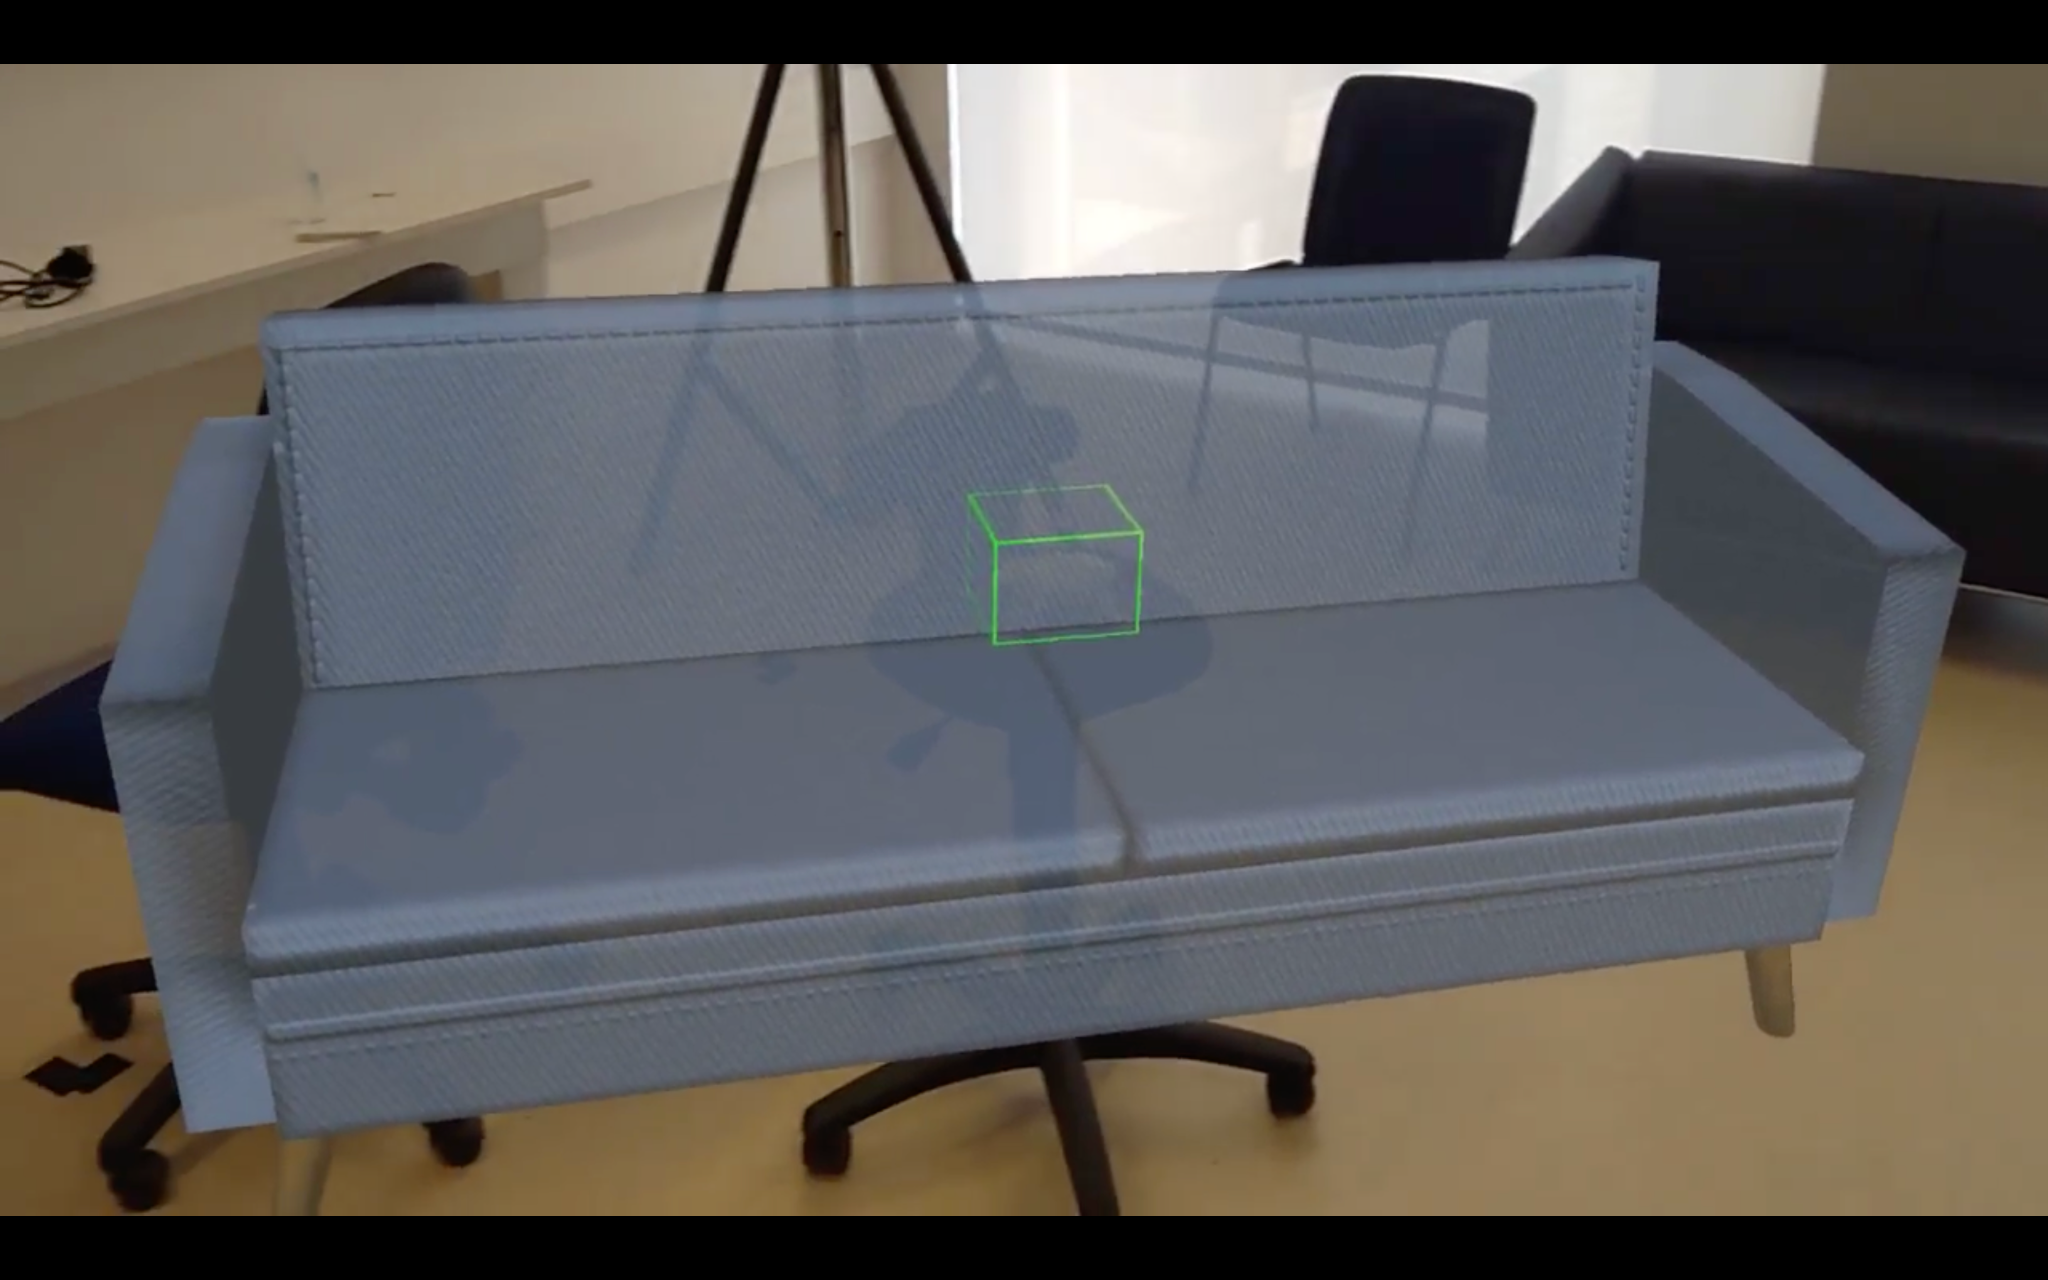
After encountering challenges with furniture placement, the idea was made to shift the focus of the app to placing virtual posters on walls. And the Vuforia Image Target feature was utilized, as it proved more reliable with 2D targets.
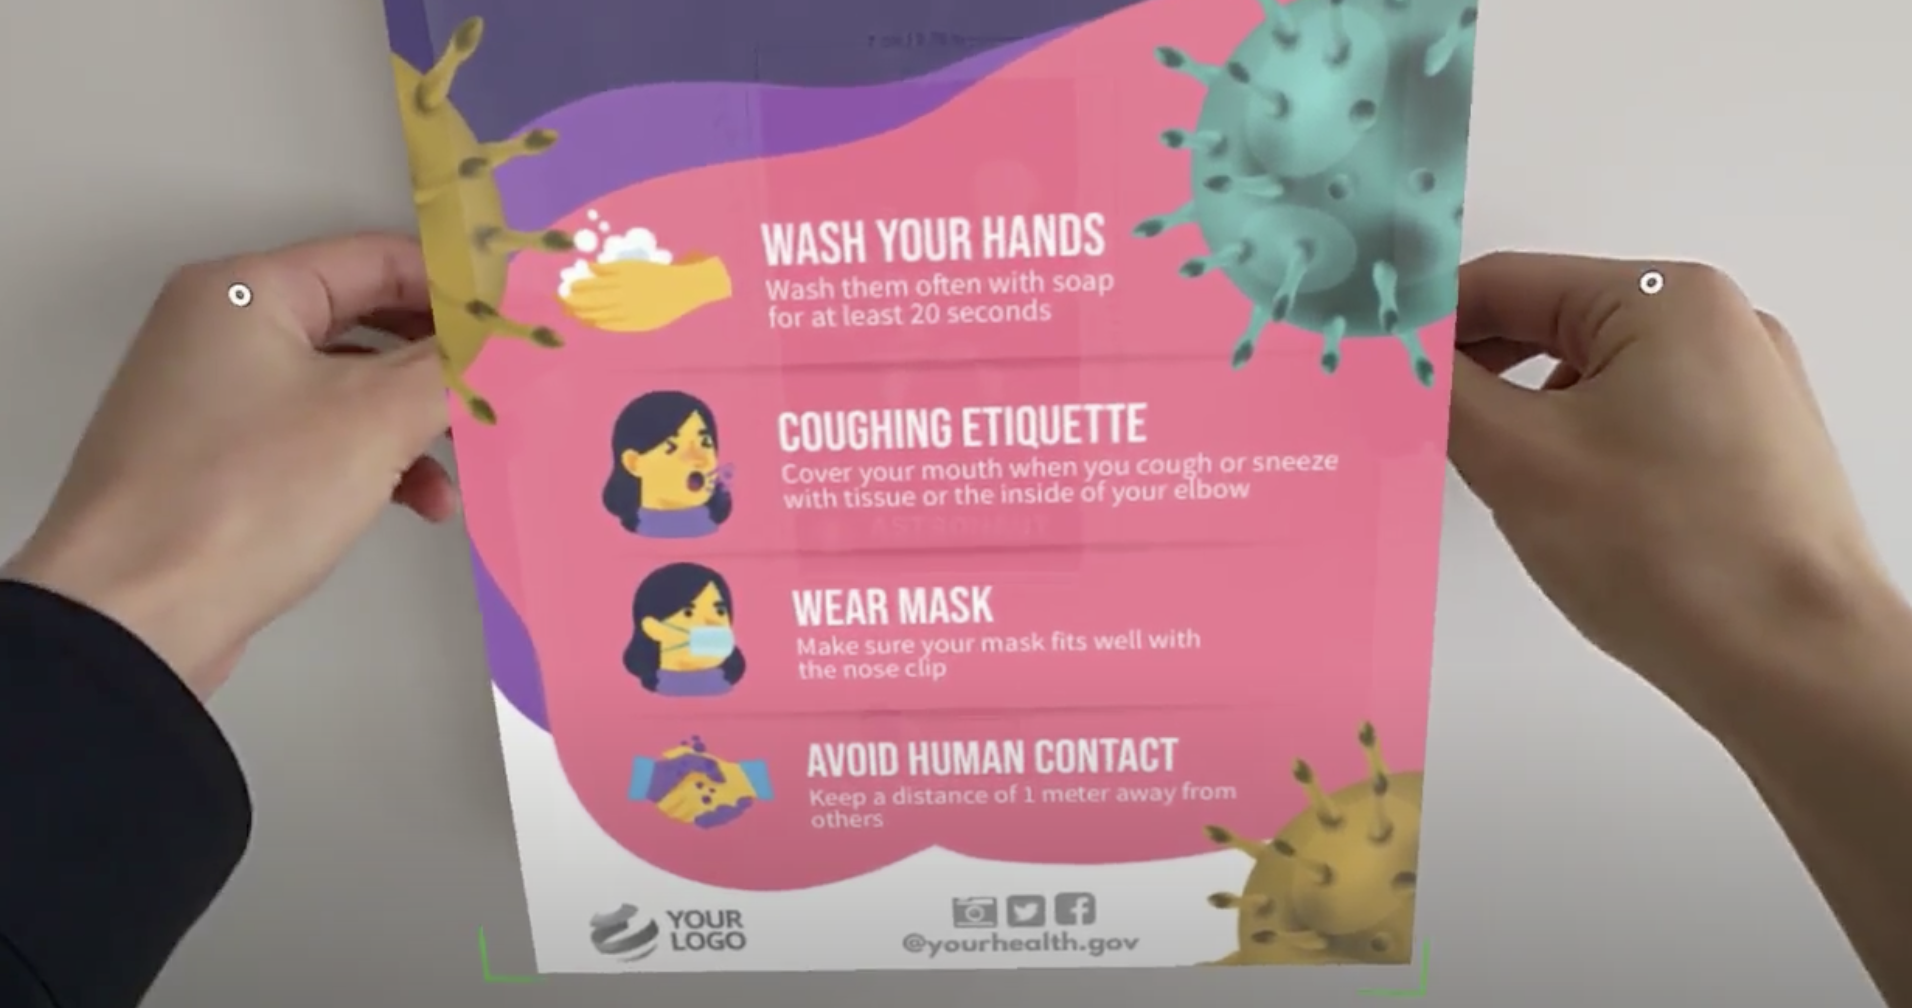
Poster placement
When the application’s camera detects a printed image target in the physical environment, Vuforia’s image recognition technology identifies the specific image and provides accurate tracking information. Once an image target is detected and tracked, the app overlays a virtual poster onto the detected surface. Users can move the virtual poster by physically moving the image.
Simple evaluation The evaluation mainly focuses on two aspects: accuracy and learning cost. Compared with the raycast method, will the tangible method - Q1: Improve precision - Q2: Reduce learning cost ?
To test our questions, we conducted a controlled experiment with 4 participants. Each participant performed a set of 10 virtual poster placement tasks using both the tangible method and the gesture method. We collected quantitative and qualitative data to evaluate precision and learning cost.
Precision: To assess precision, we analyzed placement bias for each task. Placement deviation was measured as the distance between the desired and actual placement of the virtual poster. The results show that the tangible method has lower average placement bias compared to the gestural method. This suggests that participants achieved greater accuracy in poster placement using tangible methods.
Learning Cost: To assess learning costs, we analyzed the completion time of each task and collected qualitative feedback from participants. Results showed that participants took less time to complete the poster placement task using the tangible method compared to the gestural method. Qualitative feedback also indicated that participants found the tangible approach more intuitive and easier to learn, thus reducing learning costs.